Disclaimer: This article should not be taken as, and is not intended to provide, investment advice. Please conduct your own thorough research before investing in any cryptocurrency. Please read the full London CryptoCurrency Show disclaimer HERE
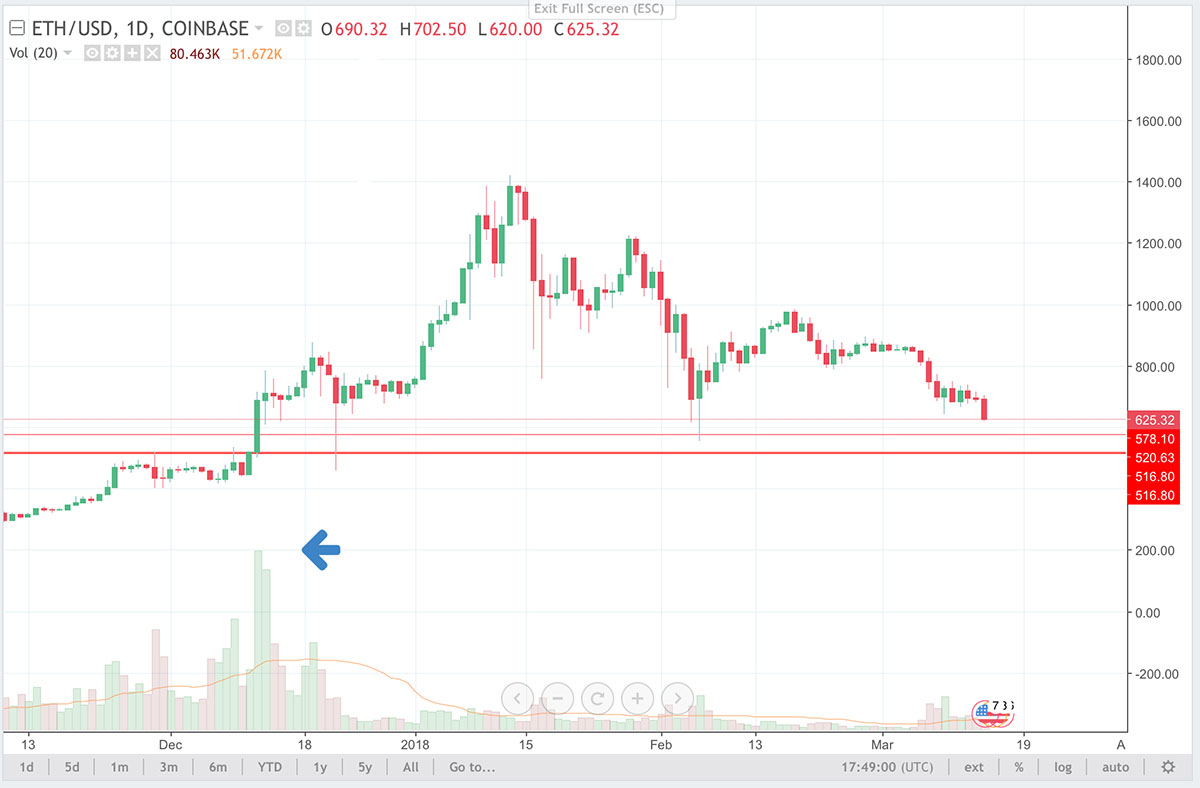
Ethereum is at a level where the bulls, (buyers) need to start showing their intentions to defend. Back on the 11th of December 2017 we saw a positive trading day closing the session at USD 518.00. The following day we opened at that exact price and saw the highest volumes yet traded in this crypto as the big rally began. (See arrow on chart) Although we have suffered from the recent sell off, the volumes have been quite small in comparison.
This could mean that the owners of this product are comfortable riding the storm or maybe there is a big test of nerves in the offing at $518!!!
The last time we saw any reaction from the bulls was on the 6th of February recovering from a low of Usd 545, so this could still do a job again as support. It will be interesting to watch volumes closely over the next few days! Traders are saying "a big jump in activity before reaching $518 would be a good thing. However, If we were to breach the $518 level it would not paint a pretty picture technically."
Disclaimer: This article should not be taken as, and is not intended to provide, investment advice. Please conduct your own thorough research before investing in any cryptocurrency. Please read the full London CryptoCurrency Show disclaimer HERE
Disclaimer: This article should not be taken as, and is not intended to provide, investment advice. Please conduct your own thorough research before investing in any cryptocurrency. Please read the full London CryptoCurrency Show disclaimer HERE
One of the most popular tools in technical analysis is candlestick charting. They were actually invented by a Japanese rice trader in the 18th century, Munehisa Homma. All charting or technical analysis is based on pattern recognition. If there has been a recurring reaction following a particular chart pattern, it is assumed that there is a strong likelihood of this occurring again. After all, chart data is just a record of human behaviour in any given situation.
Not only are candlesticks visually easy to read, Munehisa gave many shapes names in order to remember them more easily. Named after Venus and Mercury we have morning and evening stars. The morning star is the last star in the night sky before daylight comes and as such is bullish, indicating that we are to expect a period of bright skies. The opposite is the evening star which is the first star to appear before the darkness of night time. Some patterns have even more ominous names such as an abandoned baby. Needless to say this forewarns of sad times ahead.
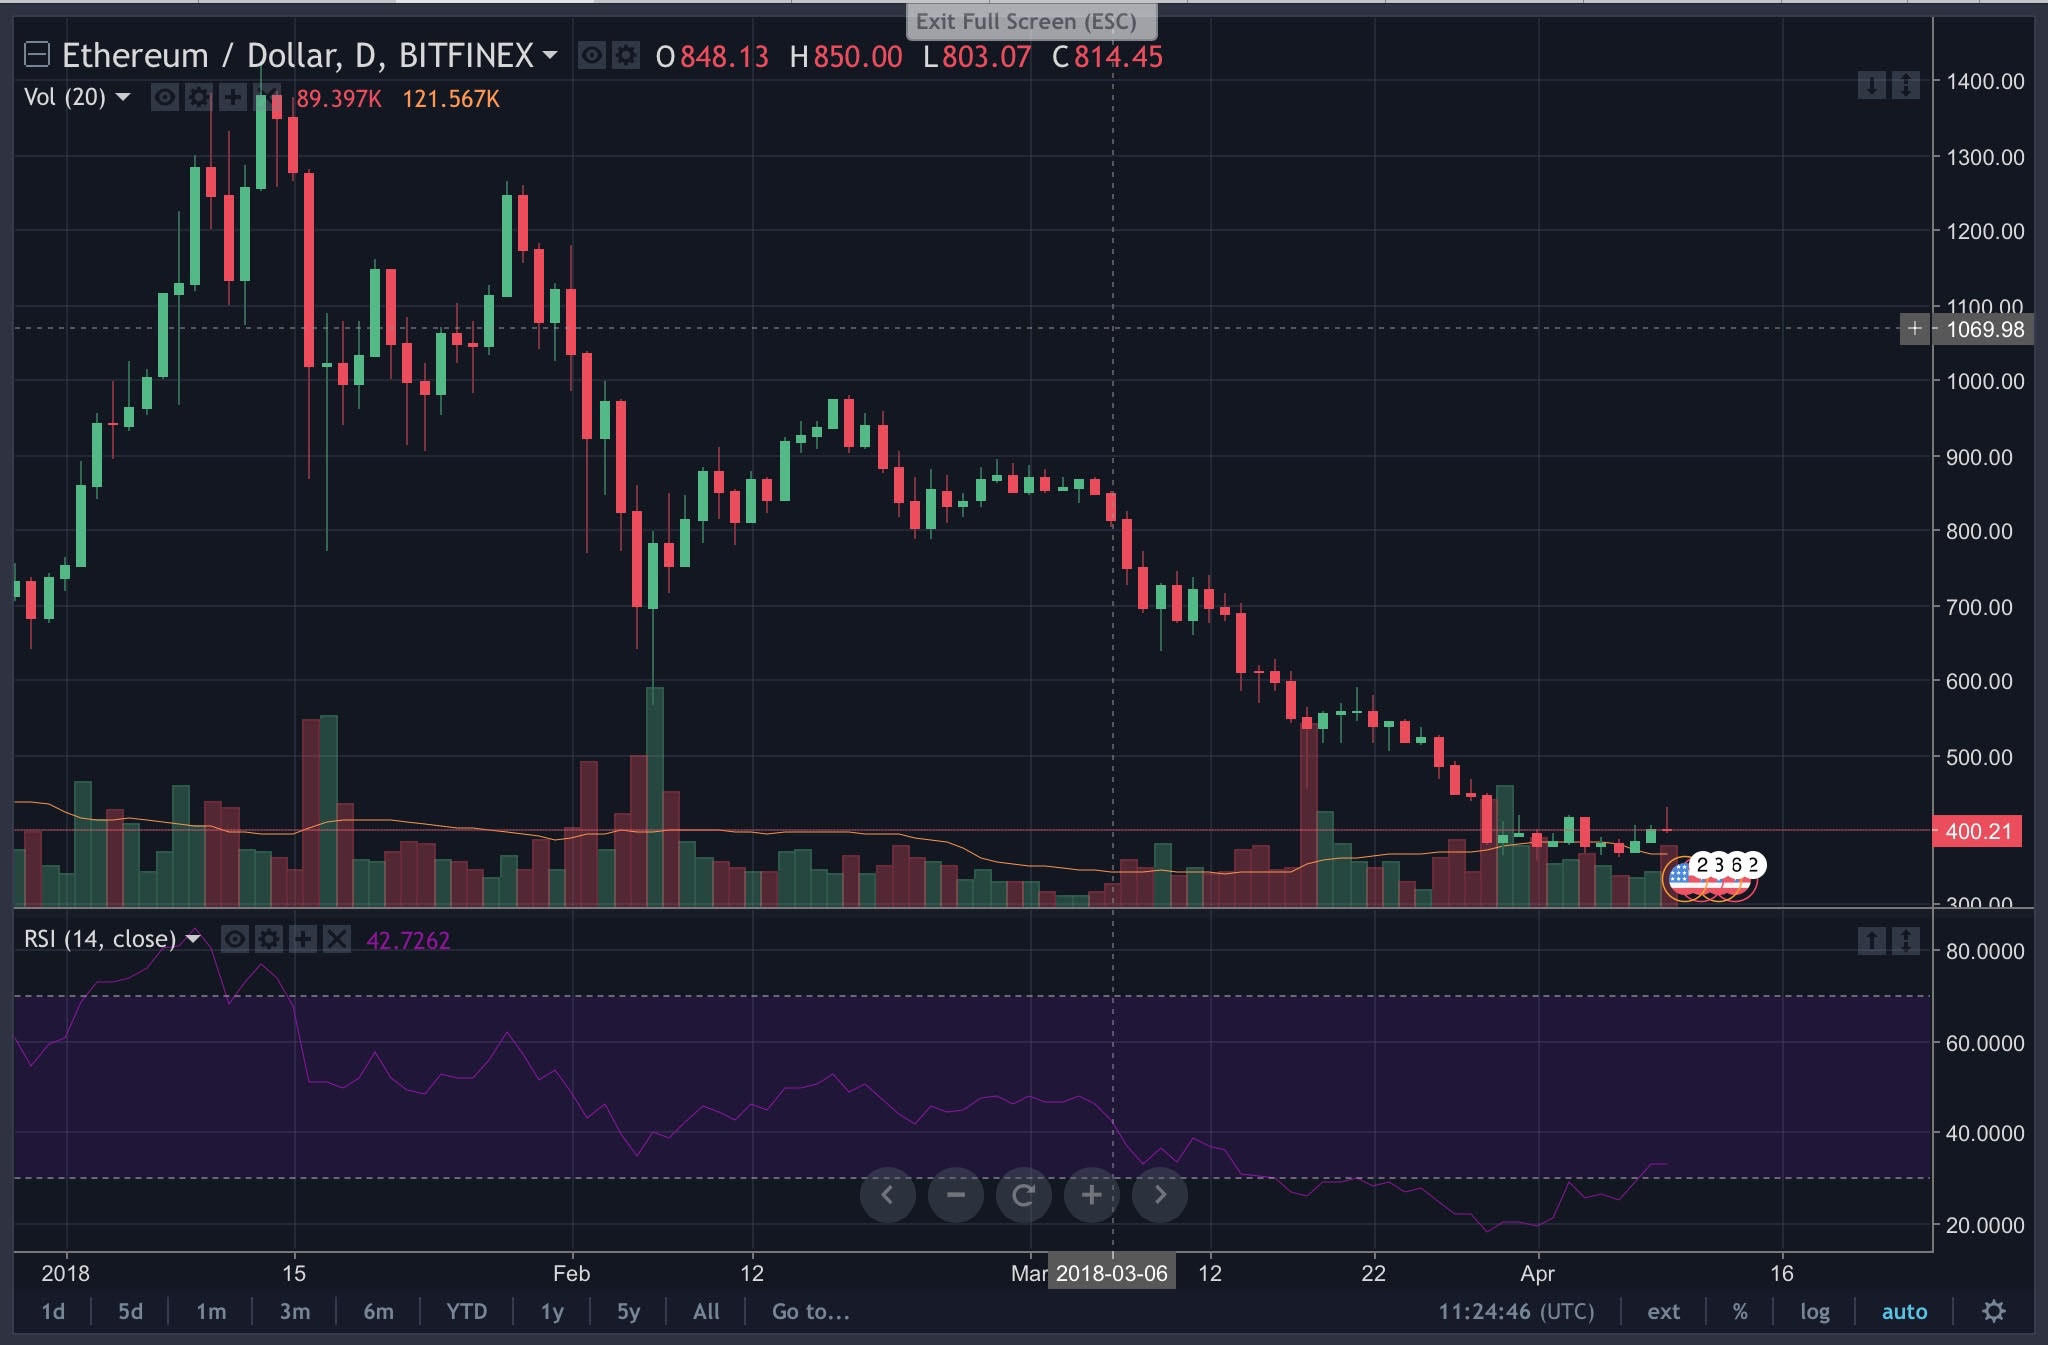
Not all pattern names are so sad as an abandoned baby, and one of those Is what we seem to be building in Ethereum right now. The move down from the 6th of March is seen as the frying pan handle and the rounding off we are witnessing right now is seen as the rounded bottom of the pan. We also have some bullish divergence on the relative strength index. This is when the market makes a new low but the RSI at the bottom of the chart actually goes in the other direction.
It seems as if the recent G20 statement that crypto currencies do not pose a risk to global financial stability is finally sinking in. Markets do not like speculation and although there will be increased regulation going forward, it would appear that even G20 now agree that this is a stable product with an ever increasing part to play in the financial infrastructure.
Disclaimer: This article should not be taken as, and is not intended to provide, investment advice. Please conduct your own thorough research before investing in any cryptocurrency. Please read the full London CryptoCurrency Show disclaimer HERE